
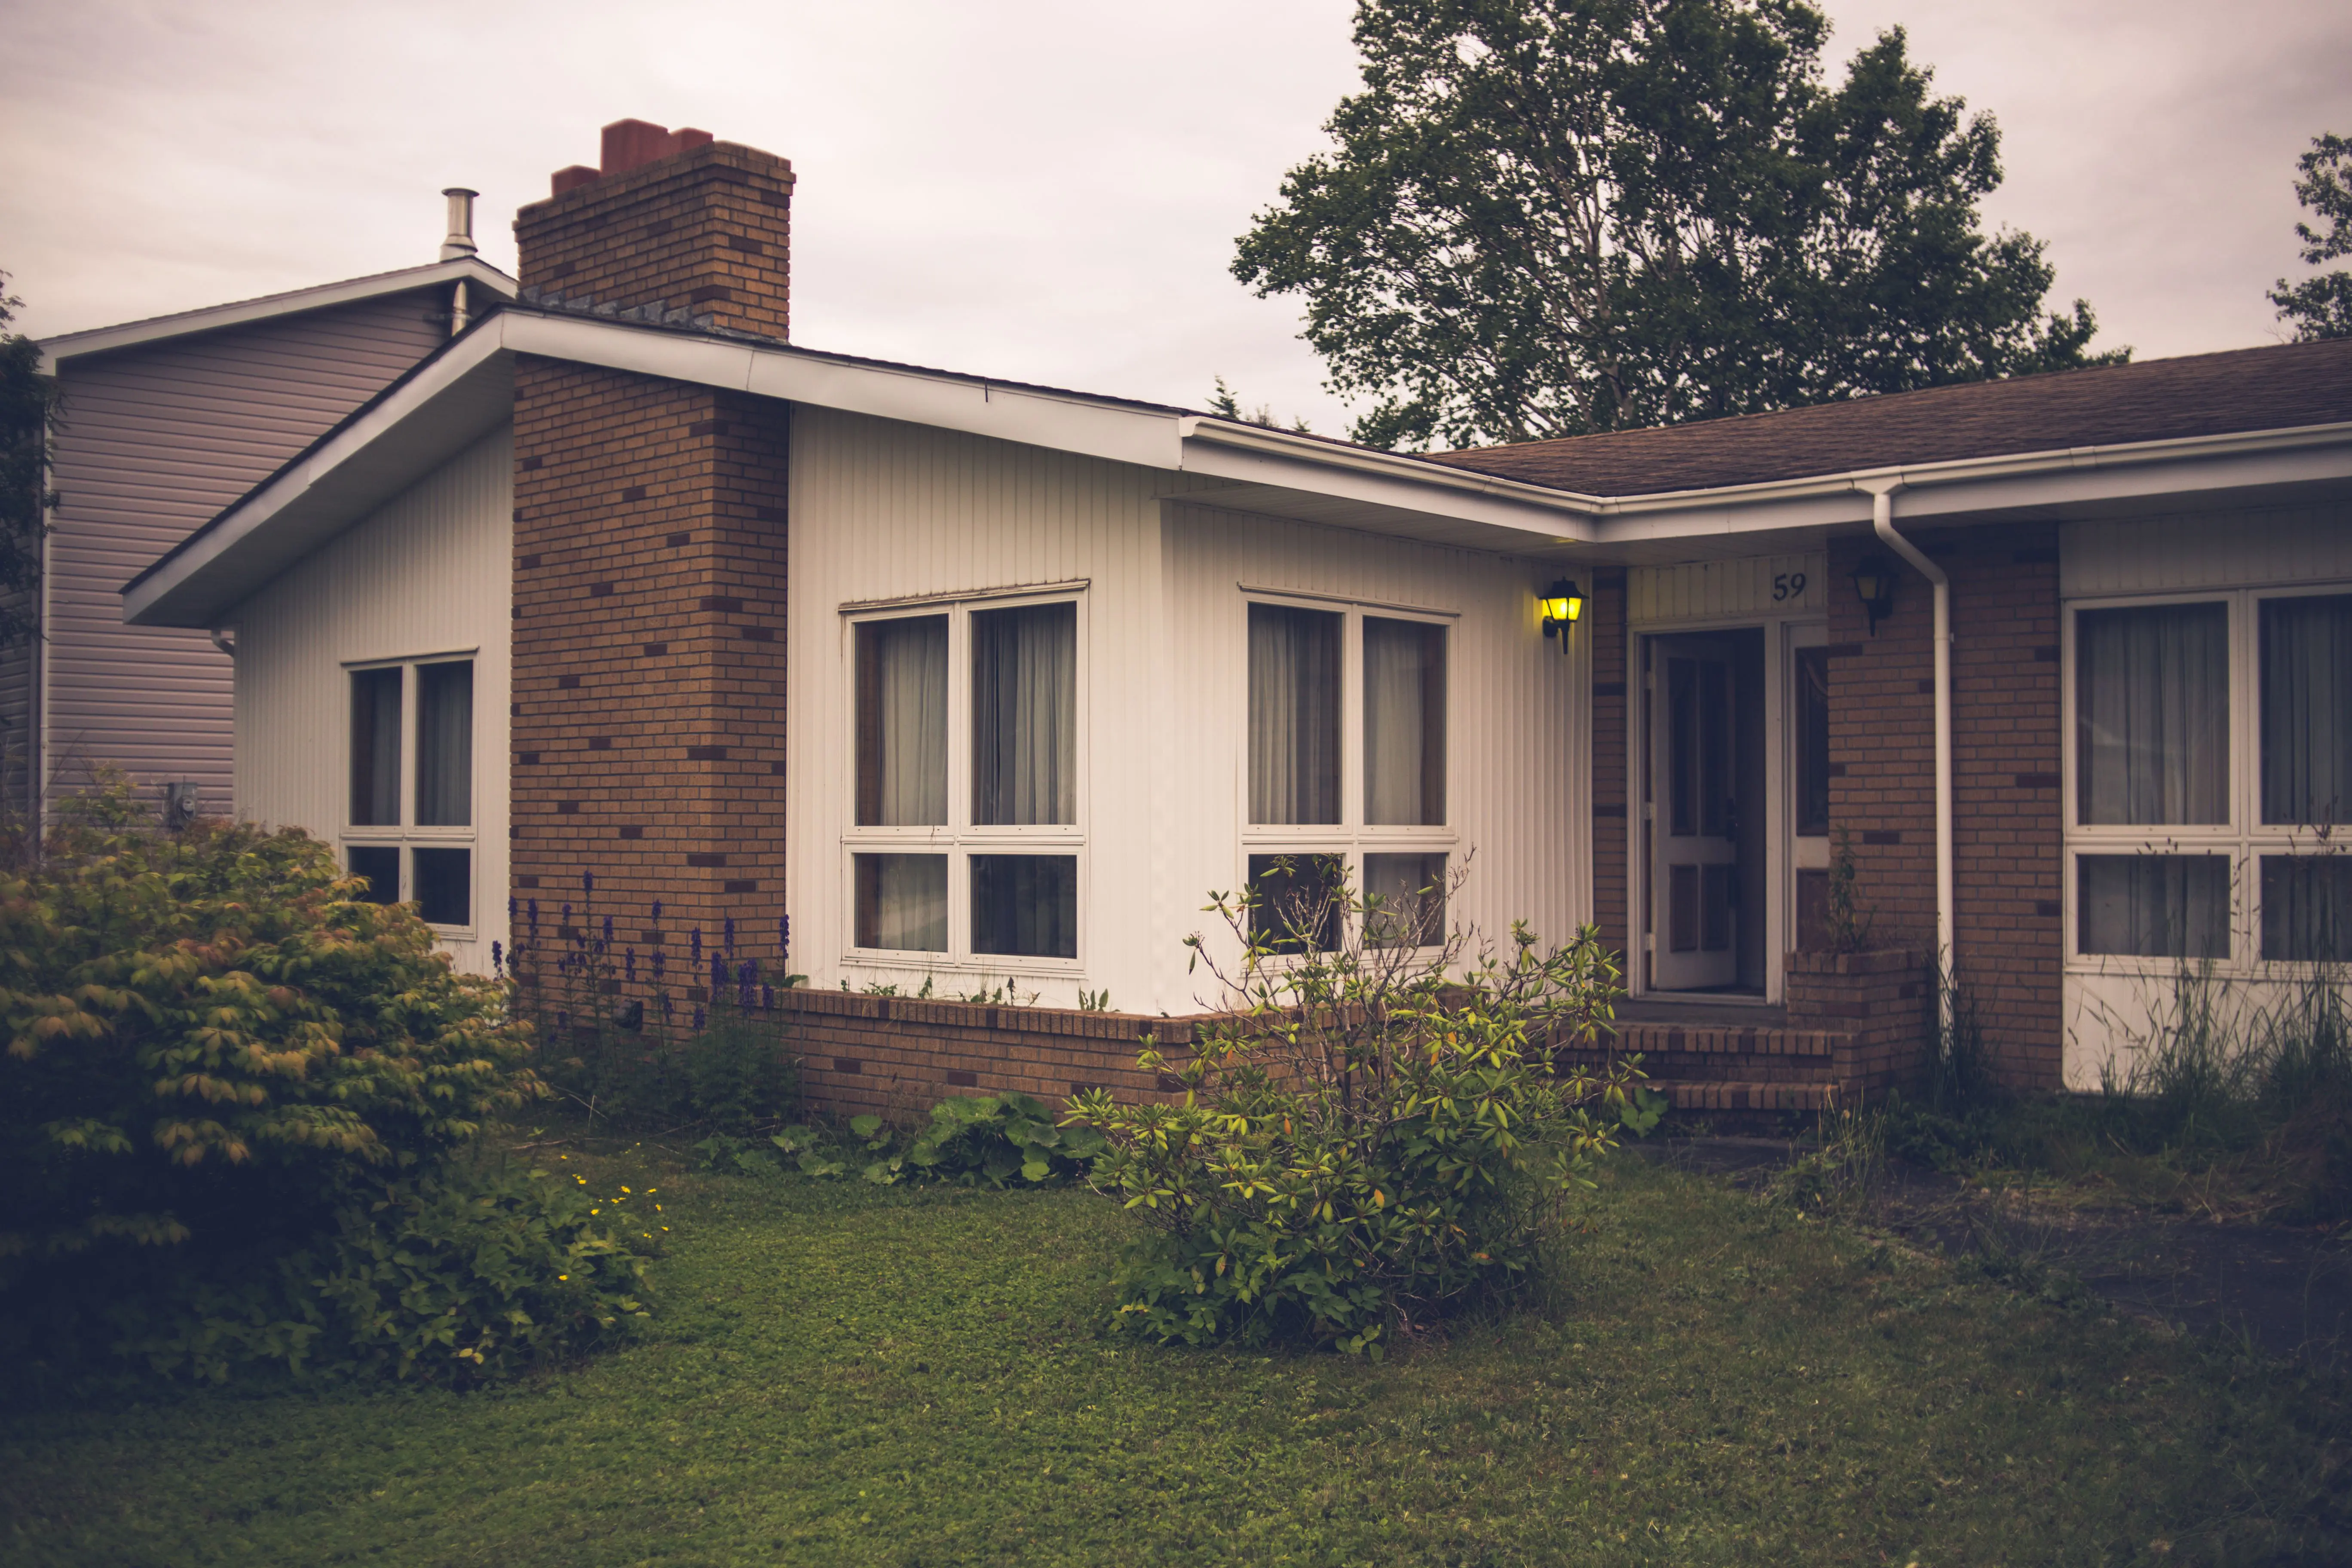
Warman’s total residential benchmark price rose to $536,900 in July, 6% above last year. Sales eased while listings and inventory increased, lifting months of supply from last July’s unusually tight level; even so, supply remains below the 10-year July average.
Warman Benchmark Home Price in July 2026
The total residential benchmark price was $536,900, up 6% year over year. The average sale price was $518,212, up 10%. Benchmark prices measure a typical home and can differ from the average price of homes that happened to sell in a given month.
- Detached homes: 19 sales with a $575,500 benchmark, up 6% year over year and a $579,142 average sale price, up 14% year over year.
- Semi-detached homes: 2 sales with a $420,200 benchmark, up 6% year over year and a $405,000 average sale price, up 10% year over year. Two sales are a thin sample, so monthly results can shift quickly.
- Row/townhouses: 2 sales with a $431,900 benchmark, up 3% year over year and a $487,450 average sale price, up 30% year over year. Two sales are a thin sample, so monthly results can shift quickly.
- Apartments: 3 sales with a $288,900 benchmark, up 2% year over year and a $228,300 average sale price, down 18% year over year. Three sales are a limited sample.
July Sales Activity
Warman recorded 26 total residential sales in July, down 19% year over year and 2% below its 10-year July average of 27 sales. Year to date through July, Warman recorded 173 sales, down 9% year over year.
- Detached homes: 19 sales.
- Semi-detached homes: 2 sales.
- Row/townhouses: 2 sales.
- Apartments: 3 sales.
Inventory, Supply and Days on Market
There were 45 new listings in July, up 7% year over year and 13% above the 10-year July average of 40 listings. Active inventory totalled 71 homes, up 18% year over year and 24% below the 10-year July average.
Months of supply was 2.73, up 46% year over year and 30% below the 10-year July average of 3.93 months. Homes that sold spent a total-residential average of 58 days on market, compared with a 10-year July average of 45 days.
What This Means for Buyers and Sellers
For buyers: Supply has improved from a year ago, giving buyers more room to compare options than last July. At 2.73 months of supply, however, well-positioned homes can still attract strong attention.
For sellers: The benchmark trend remains positive, but increased choice means homes need to be priced against current competition. Preparation and a targeted launch are important.
The Bottom Line
Warman’s July data shows a market with a benchmark price of $536,900 and 2.73 months of supply. Whether you are weighing a purchase, sale or investment decision, contact Kent Braaten for advice tailored to your property and goals.
Source: Saskatchewan REALTORS Association (SRA), Warman Monthly Market Stats, July 2026
FAQs
What was the Warman benchmark home price in July 2026?
Warman’s total residential benchmark price was $536,900 in July 2026, up 6% from a year earlier.
How many homes sold in Warman in July 2026?
26 total residential homes sold in Warman in July 2026, down 19% year over year. That was 2% below the 10-year July average of 27 sales.
What was the months of supply in Warman in July 2026?
Warman had 2.73 months of supply in July 2026, up 46% and 30% below the 10-year July average of 3.93 months.
How long did homes take to sell in Warman in July 2026?
Homes sold in an average of 58 days in Warman in July 2026, compared with the 10-year July average of 45 days.
Enjoy this blog post? Click here to subscribe for updates
Leave A Comment